When organizations decide to become more data-driven, the first step is often a new dashboard. Charts are designed, numbers are connected and a launch meeting is held. A few weeks later, the questions start. Why does the sales report show a different total than the finance report? Why are there three records for the same customer? Why is the region field empty for a third of the orders?
These questions point to a problem no visualization can solve. If the underlying data is incomplete, duplicated or inconsistent, a dashboard does not reveal the truth; it presents errors more attractively. Before investing in better reporting, it pays to invest in the quality of the data that feeds it.
01What bad data looks like
Data quality problems rarely announce themselves. They build up quietly as people enter information under time pressure, systems are connected over the years and processes change without anyone updating the records. Most issues fall into a few familiar categories:
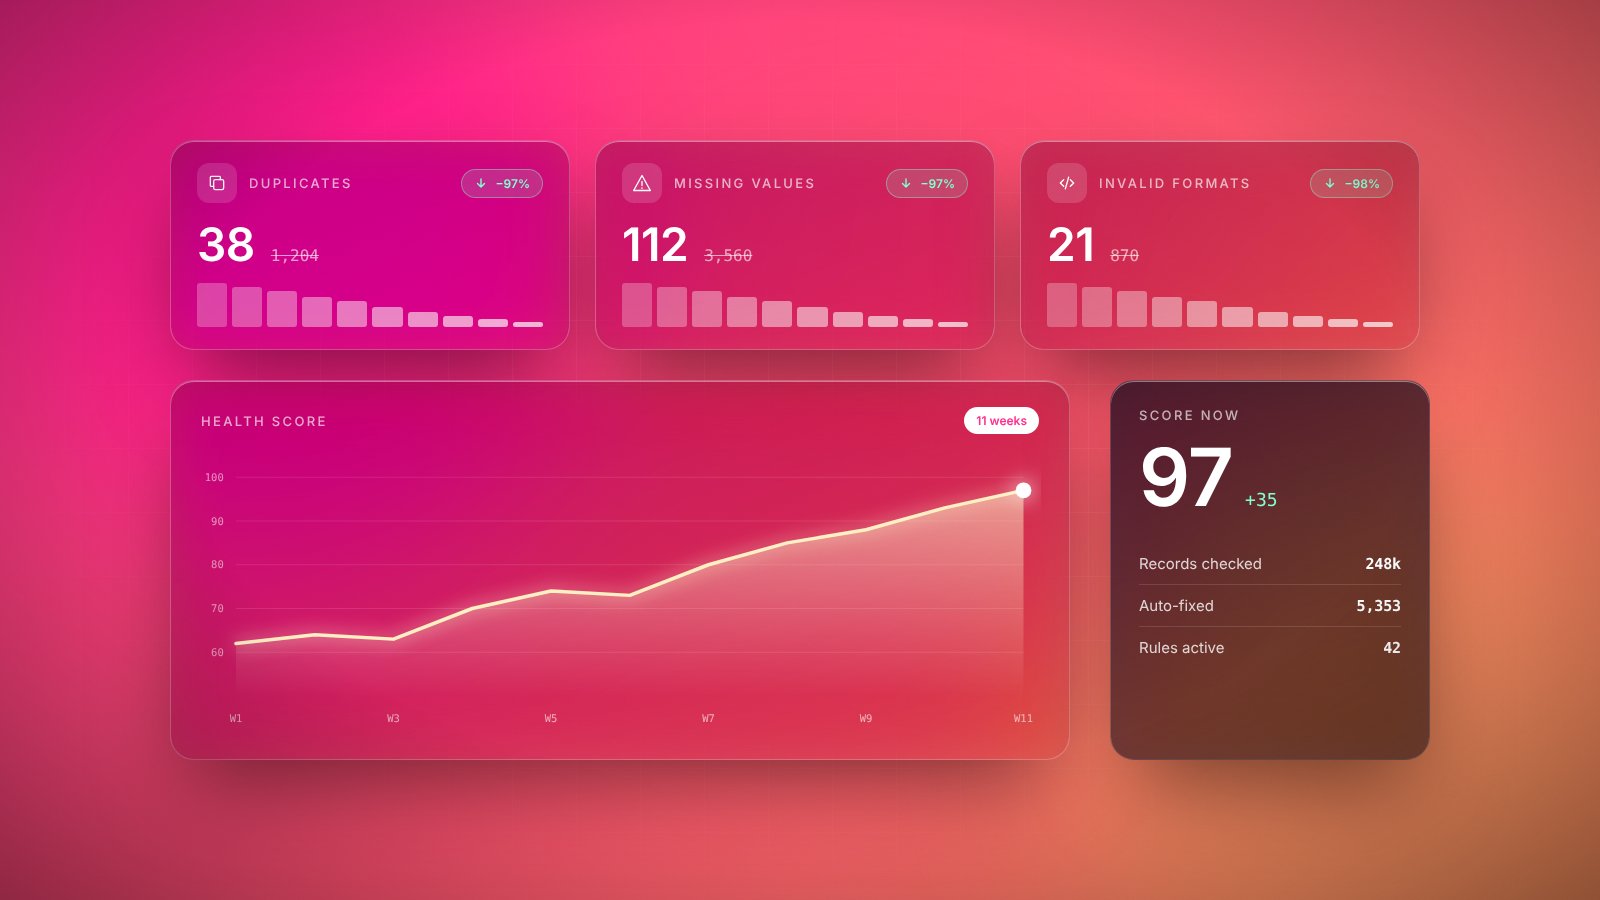
- Duplicates: the same customer, product or supplier appears several times with slightly different spellings.
- Missing fields: key information such as email, region or contract date is simply blank.
- Invalid values: dates in the future, negative quantities or phone numbers in the email field.
- Inconsistent formats: the same country written in four different ways, or prices with and without tax.
- Outdated records: addresses, contacts and statuses that were correct once but no longer are.
Each issue seems minor on its own. Together, they mean that marketing emails bounce, invoices go to the wrong address, stock levels are wrong and nobody fully trusts the reports.
02Agree on what words mean
Some of the most damaging data problems are not errors at all, but disagreements. Ask three departments what counts as an “active customer” and you may get three different answers: someone who bought in the last year, someone with an open contract, or anyone who has not formally cancelled. Each definition is reasonable. Used side by side without explanation, they produce numbers that never match.
The fix is a shared glossary of the terms that matter most: customer, order, revenue, churn, lead and whatever is central to your business. For each term, write down a plain-language definition, how it is calculated and which system holds the official version. It is unglamorous work, but it ends a surprising number of meetings spent arguing about whose spreadsheet is right.
Most arguments about numbers are really arguments about definitions.
03Give data an owner
When everyone is responsible for data quality, nobody is. Every important dataset, such as customer records, product information or supplier details, needs a named owner. That person does not have to fix every error personally, but they decide on the rules, watch for problems and have the authority to change processes that create bad data.
Owners work best when they sit close to the data’s origin. The person who manages the sales process understands customer records far better than a central team that only sees them in reports. Pair that business knowledge with technical support for the systems involved, and quality problems start getting solved at their source.
04Stop bad data at the door
Cleaning data after the fact is slow, expensive and never finished, because new errors arrive every day. It is far more effective to prevent them at the point of entry. Forms can require essential fields, offer dropdown lists instead of free text, check formats as people type and warn when a record looks like an existing one.
The same applies when data flows between systems. Each connection should check incoming records against basic rules and flag anything that fails, rather than silently passing problems downstream. Small validation steps, applied consistently, do more for data quality than any annual clean-up project.
05The foundation for AI
Data quality has become even more important as organizations adopt AI. A language model answering questions from your documents, a forecasting model predicting demand or an assistant drafting customer replies all depend on the information you give them. Feed them duplicated, outdated or contradictory data, and they will produce confident, fluent answers that are simply wrong.
Worse, AI can make bad data harder to spot. A messy spreadsheet looks messy; a polished AI-generated summary does not. That makes it essential to clean and govern the sources first. Organizations that have already done the groundwork of definitions, ownership and validation find that their AI projects move faster and deliver results people actually trust.
06Start small, stay consistent
Improving data quality does not require a large program. Pick one dataset that causes visible pain, agree on its key definitions, name an owner, add validation at the point of entry and clean up the backlog of existing errors. Measure the improvement, share it, then move on to the next dataset.
Dashboards and AI tools will keep getting better and easier to build. Their value, however, will always depend on what flows into them. Clean data is not the exciting part of becoming data-driven, but it is the part that makes everything else work.
Key takeaways
- 01Reports and AI tools are only as reliable as the data underneath them.
- 02Agree on shared definitions for key terms before arguing about the numbers.
- 03Give every important dataset a named owner who is responsible for its quality.
- 04Prevent bad data at the point of entry; cleaning it later is slower and never complete.