Big companies talk about big data: petabytes of information, teams of analysts and complex machine learning models. For most growing businesses, the reality is very different. The data is spread across a few tools, nobody is quite sure which spreadsheet is current, and the monthly report takes two days to assemble. Yet the potential is just as real. A few reliable numbers, reviewed regularly, can transform the quality of decisions.
01Start with decisions, not data
The most common analytics mistake is to start by collecting everything and hoping insight emerges. It rarely does. A better starting point is a list of decisions the business makes regularly. Which marketing channels deserve more budget? Which products should we promote? When do we need to hire? Which customers are at risk of leaving?
For each decision, ask what information would help you make it better. That question naturally narrows the data you need and gives every metric a clear purpose. A number that doesn’t inform any decision is trivia, however interesting it looks on a chart.
The goal of analytics is not to know more. It is to act better.
02Choose a few numbers that matter
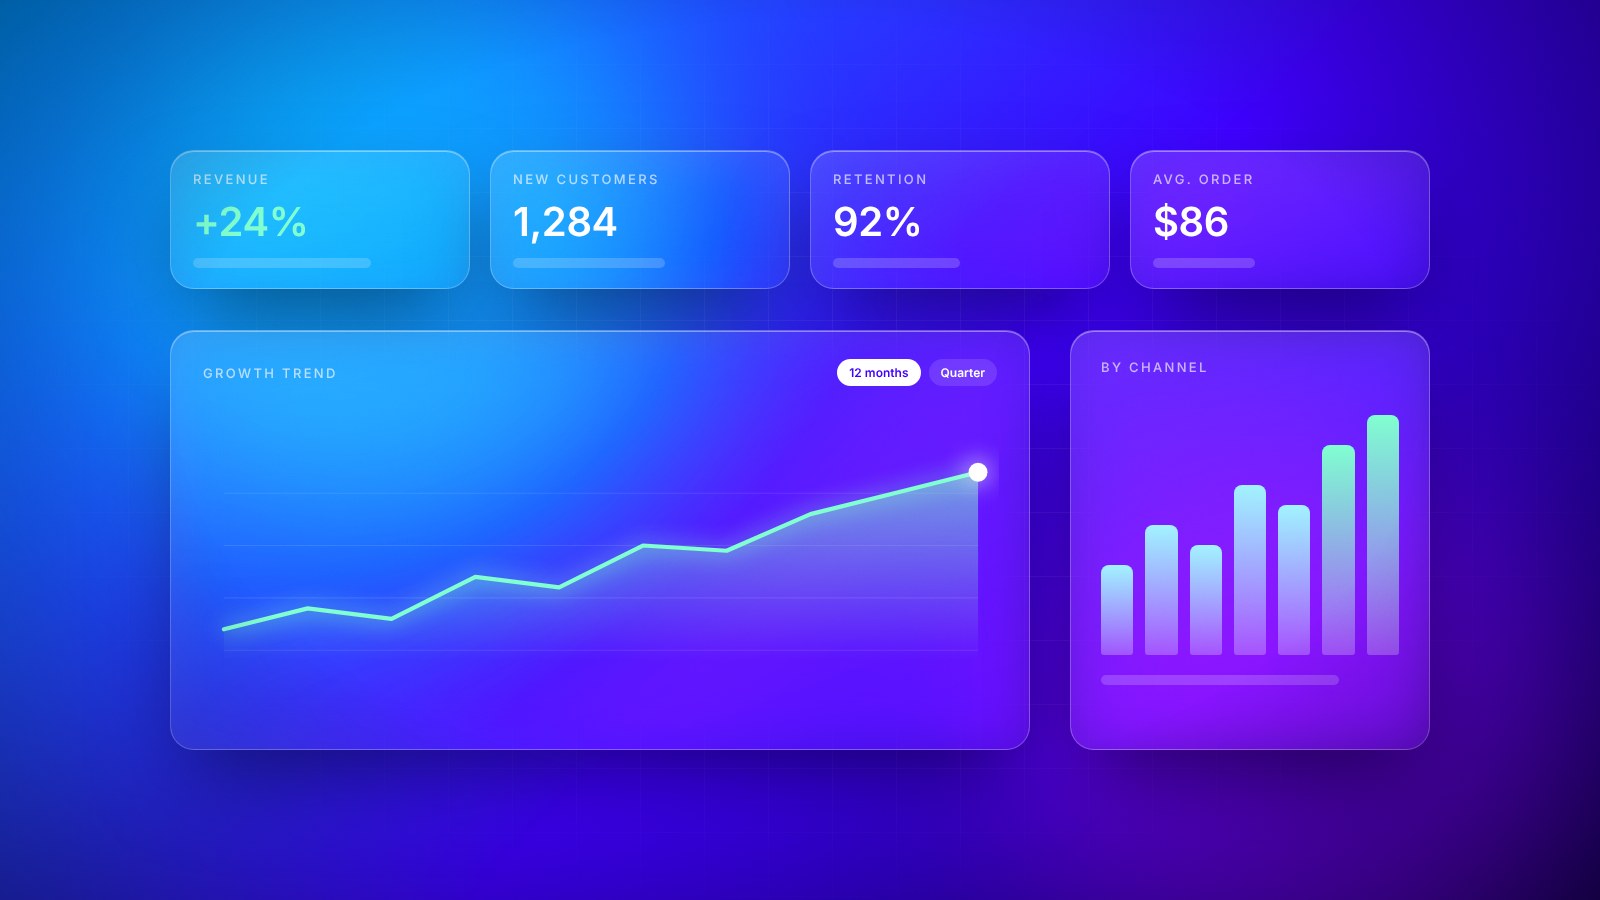
A focused set of metrics beats an overwhelming dashboard. Many businesses can run well on fewer than ten core indicators, reviewed weekly or monthly. The right set depends on the business, but it usually covers a few areas:
- Growth: new customers, revenue and where new business comes from.
- Efficiency: cost to acquire a customer, margins and time spent on key processes.
- Retention: how many customers stay, return or buy again.
- Health: cash flow, overdue invoices and capacity.
Pair results with leading indicators where possible. Revenue tells you what already happened; the number of qualified conversations this month tells you what is likely to happen next. Leading indicators give you time to react.
03Trust is everything
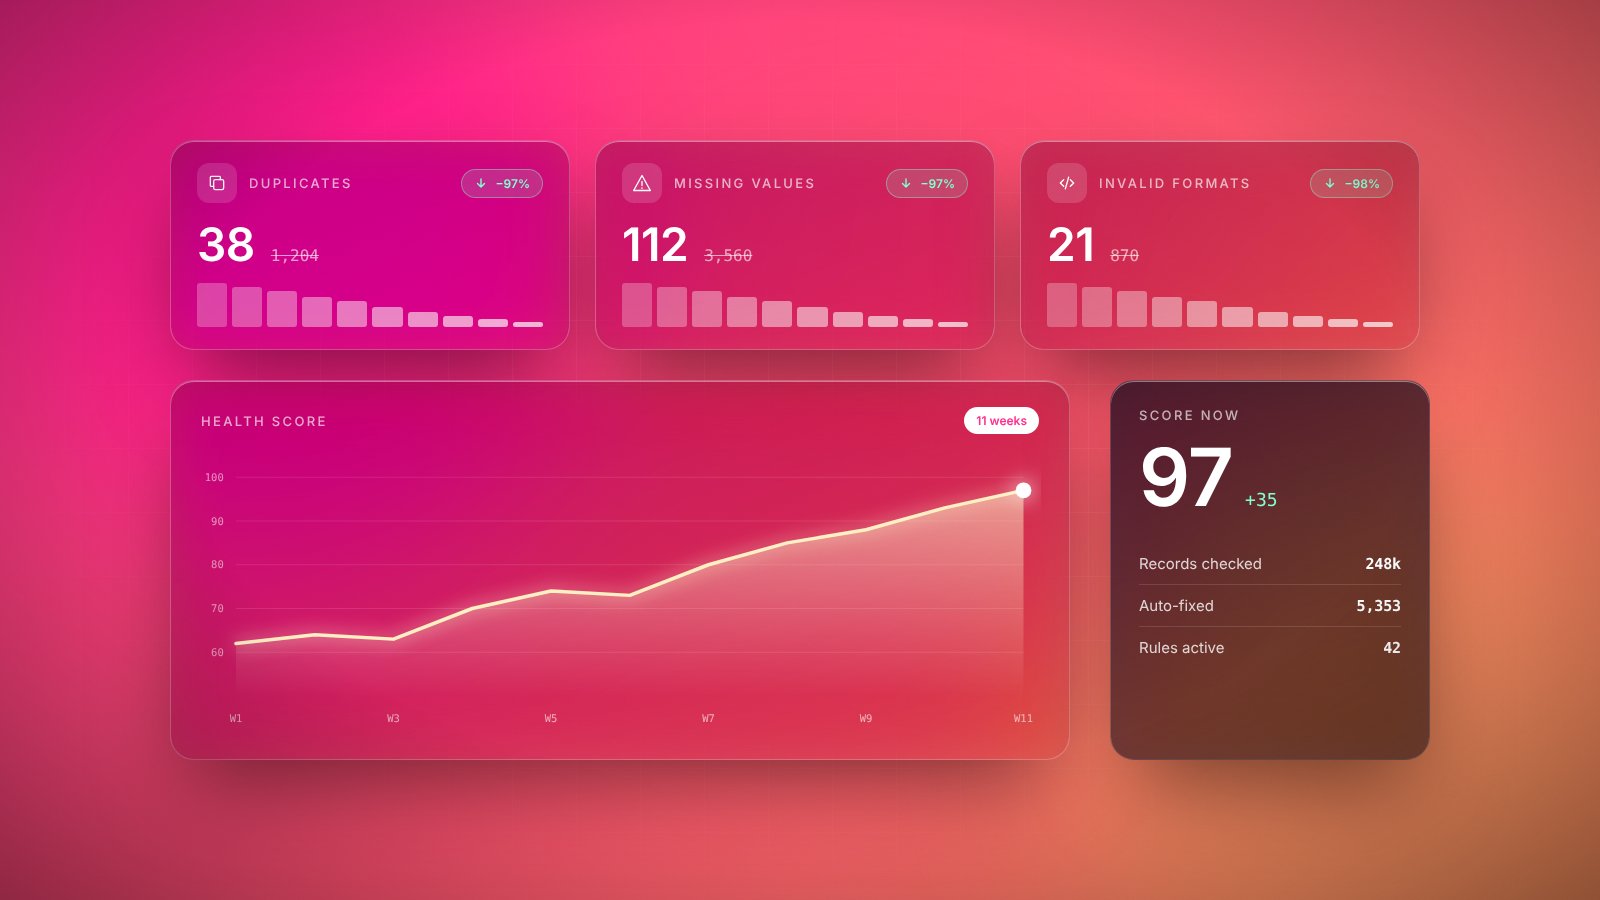
A dashboard nobody trusts is worse than no dashboard, because it creates arguments instead of decisions. Trust comes from two things: data quality and shared definitions. Quality means the numbers are complete, current and free of duplicates. Shared definitions mean everyone agrees on what a term means. Does “active customer” mean someone who bought this month, this quarter or this year? Different teams often have different answers.
Write the definitions down, keep them next to the dashboard and assign an owner to each metric. When numbers look wrong, the owner investigates. Over time this simple discipline builds a single version of the truth that the whole team relies on.
04Automate the boring part
If assembling a report takes days, it will be done less often and with more errors. Connecting your tools so that data flows automatically into one place, then into a dashboard that updates itself, frees time for the valuable part: interpreting what the numbers mean and deciding what to do.
05Common traps to avoid
Even with good intentions, analytics efforts often fall into the same traps. The first is vanity metrics: numbers that look impressive but don’t connect to outcomes, such as total page views or social media followers on their own. They feel good in a presentation but rarely change a decision.
The second is confusing correlation with causation. Sales may rise in the same month a new campaign launched, but the real cause might be the season, a competitor’s problem or a price change. Whenever possible, test changes deliberately, for example by trying something with one group of customers and not another, before concluding what works.
The third is averages that hide the story. An average order value can stay stable while a valuable group of customers quietly disappears and is replaced by smaller buyers. Breaking numbers down by customer type, channel or region often reveals what the headline figure conceals.
Finally, beware of perfectionism. Waiting for perfect data before acting means never acting. Reasonably accurate numbers reviewed every week are far more valuable than flawless numbers that arrive once a year.
06From dashboards to action
Data only creates value when it changes behaviour. The businesses that benefit most from analytics are not the ones with the most sophisticated tools, but the ones with the habit of looking at a few trusted numbers and acting on them consistently.
As AI tools become better at analysing data and answering questions in plain language, the barrier to insight will keep falling. The fundamentals, however, will stay the same: clear questions, reliable data and the discipline to act. Get those right with small data, and big decisions become much easier.
Key takeaways
- 01Start from decisions, not data: ask what you need to know to act differently.
- 02Track a handful of metrics that connect directly to goals.
- 03Data quality and shared definitions matter more than fancy tools.
- 04A dashboard is only useful if someone reviews it regularly and acts on it.